Crash data comes from TxDOT’s Crash Records Information System, covering calendar years 2021 through 2025, retrieved in a snapshot dated August 2026. Exposure and roadway attributes come from the TxDOT Roadway Inventory for 2024. TxDOT submits that same dataset to the Federal Highway Administration for the Highway Performance Monitoring System.
A crash enters the set if it involved a large truck and resulted in either an injury or a fatality. Pooled across five years, that produces 26,409 qualifying crashes, of which 20,303 fell inside retained segments and 2,207 of those were fatal.
Property-damage-only and possible-injury crashes are excluded. That last exclusion is a deliberate departure from TxDOT’s usual injury-crash convention, which counts possible injury. Dropping it holds the severity floor identical across every segment in the state.
A truck is identified using the commercial vehicle flag on the CR-3 crash report. An officer marks that box for a gross vehicle weight rating above 10,000 pounds, placarded hazardous cargo, or a capacity of nine or more passengers.
Those are the reporting thresholds on the form, not the definition in Texas law. They are also why buses have to be excluded, which we do by body style. A bus can otherwise carry the same commercial flag as an 18-wheeler.
Counting crashes alone rewards a road for being long and busy. A stretch of urban freeway carrying millions of truck miles will almost always out-count a rural highway, no matter how dangerous the rural highway is. Dividing by truck miles removes that advantage.
So every figure is a rate: crashes per 100 million truck miles. Rather than compare whole roads of massively different lengths, we split the network into segments so roads could compete against themselves. Some roads have extremely dangerous stretches alongside areas that are largely safe.
About 58,000 centerline miles of Texas highway were retained for analysis. Those segments carry roughly nine in ten truck miles driven on the state highway system.
Every road class on the state system competed on the same measure: interstates, US routes, state highways, and Farm-to-Market and Ranch-to-Market roads. Truck traffic is measured on the main lanes only, not on frontage roads or tolled managed lanes. Nothing was ranked solely against its own kind, which is how a four-lane state highway can outrank a nine-lane freeway carrying far more traffic.
The crash-rate list requires at least 25 crashes and 60 million pooled truck miles. The fatal-rate list requires at least 5 fatal crashes, 20 total crashes, and 50 million truck miles. Requiring both a fatal floor and a total-crash floor keeps out small samples posting extreme lethality on a dozen crashes.
Endnotes
a. Baselines are for the network we studied. The rates of 14.5 crashes and 1.57 fatal crashes per 100 million truck miles are network figures, as is the 10.87 percent lethality. All three are computed across the 2,854 segments retained here, not across every Texas road. Those segments hold 20,303 of the 26,409 qualifying crashes and 2,207 of the fatal ones.
The rest either fell outside a retained segment or could not be placed on one. Of 2,621 fatal crashes in the full set, 2,207 sit inside retained segments, an 84 percent share against 77 percent for crashes overall. So the lethality baseline runs slightly high, which makes the multiples here conservative rather than inflated.
Against wider denominators the SH 349 multiple ranges from 8.3 to 9.3 times the baseline. The finding does not depend on which scope is chosen.
b. How the averages are computed. Lane count, posted speed, and truck share are length-weighted averages across each segment, not single values. So a 74.9 mph average does not mean every mile is posted at 75.
In the two-list comparison, lethality is a pooled ratio of fatal crashes to all crashes. Lanes and truck share in that comparison are simple means.
c. Segment length and labels. Segments are uniform 25-mile bins in TxDOT’s linear referencing, fixed before any ranking was run. Actual covered mileage varies, because a route can end inside a bin or the mapping can carry a gap. Only bins with at least 10 covered miles were kept.
Place names in each label are the nearest recognizable anchors to the endpoints, not the endpoints themselves. Two anchors are rarely exactly 25 miles apart. Two-lane and Farm-to-Market roads carry too few crashes per bin to rank at this scale.
d. Truck share changes what a rank means. A truck’s risk comes from all the traffic around it, not just other trucks. A high rate at three percent trucks says less than the same rate at 25 percent. Truck share appears on every row for that reason.
e. Exposure is modeled and single-year. Truck miles come from TxDOT’s 2024 truck traffic counts multiplied by segment length and the five-year window. Those counts are modeled on most segments, and least precise where volumes are lowest. Applying one year across five assumes traffic held roughly steady, which matters most on oilfield roads where activity swings.
f. Roads that changed mid-window. Lane counts and traffic come from the 2024 inventory. Where a corridor was rebuilt during the crash window, those attributes describe its later configuration rather than all five years.
g. Rural and urban coding. Each segment carries one rural or urban code rather than a blend, so a stretch crossing a city limit is labeled one or the other. The values follow the legacy federal Rural/Urban Designation scheme. TxDOT publishes no numeric table for the field, so the mapping is inferred.
h. Ranking precision. An earlier version ranked segments by the lower bound of a Poisson interval, which shrinks rates built on small counts. We switched to observed rate so the tables would read plainly for a general audience. The top three on the fatal-rate list are identical under both methods.
Positions 11 through 15 move by three to eleven places under the interval method, and several interstates rise into that range. Read the top of each list as an order and the bottom as a group.
i. The 2025 data year. Total crashes rose 1.3 percent in 2025 while fatal crashes fell 11.2 percent. December 2025 records 29 fatal truck crashes against a range of 41 to 58 across the four prior Decembers. That is consistent with fatal-specific reporting lag in the final month, and no figure here has been adjusted for it.
j. Attribute fields were screened, not validated. We compared every ranked segment’s lane count and truck share against the other segments on its own route, looking for values out of step. That is a screen, not a validation. The largest discontinuity it found, on US 79 east of Carthage, turned out to be a real corridor boundary confirmed by TxDOT records.
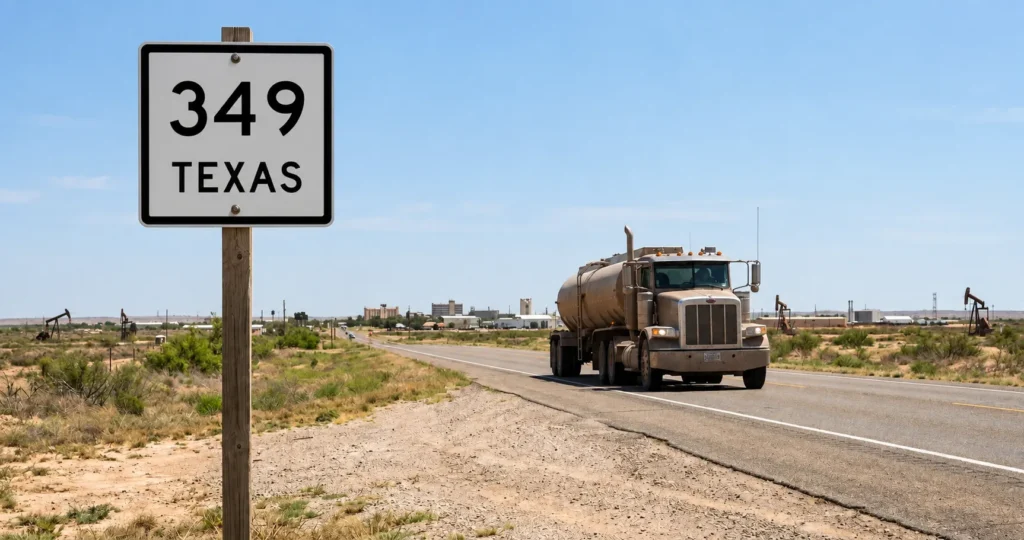
A second flag, SH 349 north of Upton County, was left in place for the same reason. Its 44.1 percent truck share fits the oilfield corridor around it. A clean screen is not evidence that a field is correct.
k. County names come from geometry. The county codes attached to the segment file contradict the segments’ own mapped coordinates on eight of the ranked entries. The offsets are not consistent, so the field cannot be corrected by rule. Counties here are read from each segment’s coordinates instead.
l. Frontage roads and ramps. Crashes were matched to segments by distance, so an urban freeway count can include crashes on frontage roads and ramps. On I-635, 30 of the 285 fell there, leaving 255 on the main lanes. The rural segments are mostly unaffected, since most carry no frontage roads.
Every urban entry is exposed to this, not only I-635. Recounting all of them on main lanes alone would lower the urban rates and leave the rural ones nearly unchanged, which would widen the gap this study reports. We have left every row on the same basis rather than correcting one.