What Federal Crash Data Reveals About Self-Driving Car Safety

Every article on this site is researched by our internal team, reviewed for legal accuracy against current Texas law, and held to State Bar of Texas advertising standards before publication. We do not publish content that overstates outcomes or makes promises about results.
Learn more about our
editorial standards .
Key Takeaways
- NHTSA recorded 1,538 ADS crashes, but without mileage data, the reports cannot establish which companies are safer.
- About 76% of crashes involved ADS vehicles traveling under 10 mph, yet 154 crashes included a reported injury category.
- Your claim depends on the evidence from your specific crash, including the actions of any onboard safety operator.
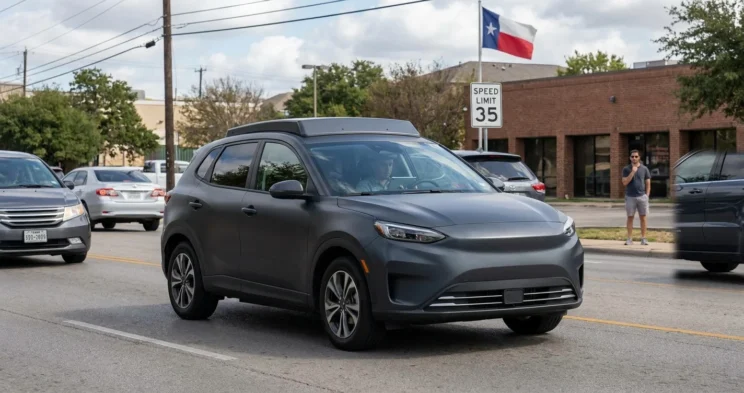
You are driving along MoPac Expressway in Austin when a driverless vehicle pulls into the lane beside you. You wonder how often these vehicles crash and what federal safety reports reveal about the risks.
NHTSA’s Standing General Order crash reports offer part of the answer. Our analysis includes 1,538 unique ADS crashes through August 2026, including one report from April 2025. September 2026 crashes are excluded.
The dataset covers automated driving systems (including robotaxis and test vehicles), not Level 2 driver-assistance systems.
These are crash counts, not crash rates. Without comparable mileage data, they cannot establish which companies are safer.
Waymo accounts for 1,273 crashes (or about 83% of the dataset), but this share does not establish fleet size or relative safety.
Reports may include crashes in which an ADS was active within 30 seconds before impact, even if it disengaged before the crash.
If you were injured in a driverless vehicle crash, fleet-wide statistics cannot determine fault or the validity of your claim. These questions depend on the evidence from your specific crash.
What NHTSA Crash Data Shows About Injuries and Vehicle Speeds
The reports show a range of outcomes, from no reported injuries to fatal crashes.
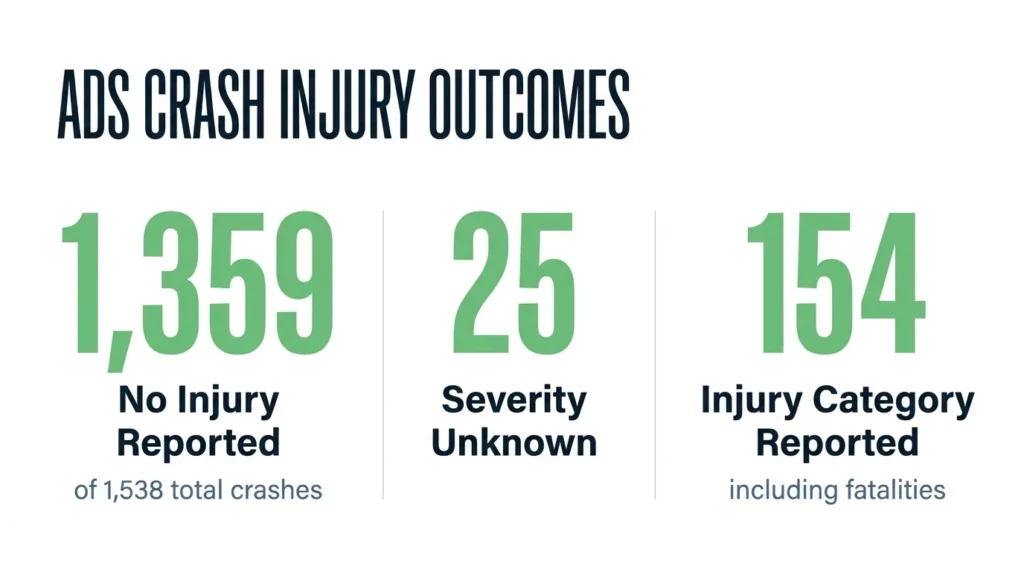
The first table summarizes the reported injury categories across all 1,538 crashes:
| Reported injury category | Crashes |
|---|---|
| No injury reported | 1,359 |
| Severity unknown | 25 |
| Injury category reported, including fatalities | 154 |
| Total | 1,538 |
The 154 crashes with an injury category can be broken down further by the highest reported injury severity:
| Highest alleged injury | Crashes |
|---|---|
| Minor, no hospital | 97 |
| Minor, hospital or emergency treatment | 38 |
| Moderate, no hospital | 4 |
| Moderate, hospital or emergency treatment | 9 |
| Serious, hospital or emergency treatment | 4 |
| Fatal | 2 |
53 crashes (3.4%) fall into hospital or fatal categories. Under NHTSA’s data definitions, hospital categories include emergency treatment, so these crashes did not all involve serious injuries. Counts represent crashes, not injured people, and “no injury reported” does not prove that no one was hurt.
Airbags were deployed in at least one vehicle in 82 crashes. In 29 crashes, airbags were deployed in the automated driving system (ADS) vehicle itself.
Reported speeds offer another way to understand the crash records, although they do not tell the whole story.
NHTSA recorded the following speeds for the ADS vehicles:
| Reported ADS-vehicle speed | Crashes | Share |
|---|---|---|
| 0 mph | 785 | 51% |
| 1-9 mph | 381 | 25% |
| 10-24 mph | 256 | 17% |
| 25-44 mph | 96 | 6% |
| 45 mph or faster | 20 | 1% |
About 76% of crashes recorded an ADS-vehicle speed below 10 mph, while the highest reported speed was 65 mph. This field does not measure impact force, closing speed, or another vehicle’s speed. A stopped ADS vehicle can still be involved in a crash that causes serious harm.
Vehicle speed is only one part of the picture. The types of road users involved are also a factor, particularly when a crash involves someone outside a passenger vehicle.
Forty crashes (2.6%) involved motorcyclists or other non-motorists, including cyclists, pedestrians, scooter and skateboard riders, and two records classified as “Other Non-Motorist.” Eighteen involved an injury category, and these crashes accounted for both reported deaths.
In its September 2025 Tempe report, Waymo said a motorcycle struck its slowing vehicle from behind before another car hit the fallen rider.
In its August 2026 Dallas report, Waymo said an SUV struck a pedestrian, who then contacted the slowing, unoccupied Waymo.
These company accounts do not independently establish fault.
How Reported Automated Vehicle Crashes Differ by Company
Crash patterns vary across the companies in the dataset. However, these figures cannot establish which company is safer.
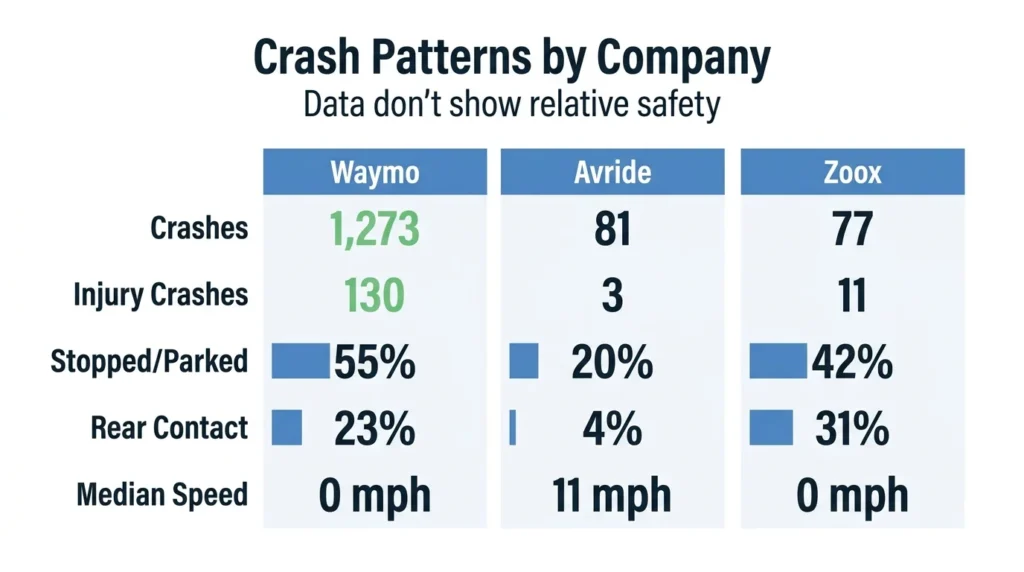
Waymo accounts for most of the reports, while every other company has a much smaller sample:
| Reporting company | Crashes | Injury crashes | Stopped or parked | Rear contact recorded | Median reported speed |
|---|---|---|---|---|---|
| Waymo | 1,273 | 130 | 55% | 23% | 0 mph |
| Avride | 81 | 3 | 20% | 4% | 11 mph |
| Zoox | 77 | 11 | 42% | 31% | 0 mph |
| Tesla | 36 | 2 | 36% | 3% | 1 mph |
| May Mobility | 20 | 4 | 25% | 25% | 5.5 mph |
“Rear contact” identifies a reported contact area on the ADS vehicle. It does not prove the vehicle was rear-ended or another driver was at fault, and contact areas may overlap. Tesla’s entry refers only to this ADS dataset, not consumer driver-assistance data.
The dataset also identifies crashes involving several companies in Texas, although these counts do not show how often their vehicles crash per mile driven.
The following figures show the reported locations:
| Company | Texas location | Reported crashes |
|---|---|---|
| Zoox | Austin | 5 |
| May Mobility | Arlington | 7 |
| Nuro | Houston | 4 of 7 total |
Analyzing Avride’s Automated Vehicle Crash Reports
All 81 Avride crashes in our analyzed dataset occurred in Texas. 54 occurred in Dallas, and 27 occurred in Austin. These figures describe the analyzed release, not Avride’s complete crash history.
A human safety operator was onboard in all 81 Avride crashes included in our dataset. However, the operator’s presence alone does not establish whether they were controlling the vehicle, could have prevented the crash, or contributed to it. These questions depend on the specific circumstances and evidence in each case.
Avride’s median reported speed was 11 mph:
63 records show positive speed
11 show at least 25 mph
The maximum was 30 mph
16 list stopped/parked movement (a smaller share than Waymo’s)
Crash records cannot show which fleet spends more time moving.
The reports also record what the Avride vehicle was doing at the time of each crash. Of the 81 crashes, 65 listed the vehicle as “moving,” while 16 listed it as “stopped or parked.”
The reported movements in those 65 moving crashes were:
| Reported vehicle movement | Crashes |
|---|---|
| Going straight | 45 |
| Changing lanes | 7 |
| Turning left | 5 |
| Merging | 2 |
| Backing | 2 |
| Turning right | 1 |
| Other | 2 |
| Unknown | 1 |
| Total | 65 |
The reports also identify the parts of the Avride vehicle that were contacted during a crash:
| Reported ADS-vehicle contact area | Crashes |
|---|---|
| Front | 14 |
| Right side | 13 |
| Left side | 9 |
| Rear | 3 |
Contact areas can overlap, so these counts should not be added to calculate a total number of crashes.
Avride’s monthly counts peaked at 14 crashes in March 2026. Counts can change with fleet activity and reporting, so the peak does not establish a change in crash rate.
Three Avride crashes had a reported minor-injury category. In January 2026, a Dallas crash involving a passenger car included a hospital visit. In July 2026, Austin reports described a wrong-way e-bike rider who lost control and slid into the vehicle, and a scooter rider who entered a crosswalk against the signal. These are company reports, not independent findings of fault.
Understanding Texas Automated Vehicle Laws After a Crash
Under Texas Transportation Code § 545.454, an engaged automated driving system is treated as the vehicle’s operator for traffic law compliance. Citations may be issued to the owner or authorization holder (if it is an authorized commercial vehicle). This does not automatically determine who must pay for injuries.
Senate Bill 2807 created an authorization program for commercial automated-vehicle operations in Texas. The law took effect September 1, 2025, and authorization requirements became enforceable May 28, 2026. Whether those requirements apply depends on the crash date and the vehicle’s operation.
After a crash, preserve the police report, witness contact information, photos, and medical records. Ask an attorney about obtaining vehicle video footage and data, ADS engagement records, control transfer logs, and evidence of other road users’ actions.
An onboard operator’s actions may support your claim, depending on the evidence. An attorney reviewing your Texas car accident claim can assess who controlled the vehicle, how the operator responded, and which parties may be responsible. Fleet statistics alone neither prove nor dismiss your claim.
Talk to Angel Reyes & Associates About Your Self-Driving Car Crash in Texas
If an ADS vehicle was involved in your Texas crash, identifying who may be responsible requires examining the evidence and the actions of everyone involved.
Angel Reyes & Associates has helped injured Texans through the legal process for over 30 years, and we have recovered more than $1 billion for our clients. We work on contingency, which means you pay no fees unless we win your case. Contact our firm today for a free consultation to discuss your crash, your legal options, and what steps may help protect your claim.
Past results do not guarantee future outcomes.
Self-Driving Car Crash Data FAQs
Are self-driving cars completely safe?
No vehicle is completely safe, including one with automated driving technology. Self-driving systems can make mistakes when detecting objects, responding to unexpected situations, or handling difficult road conditions.
What is the difference between a self-driving car and a car with driver assistance features?
A self-driving car is designed to perform driving tasks using automated technology. Driver assistance features (such as lane-keeping assistance or adaptive cruise control) can help a human driver but generally do not replace the driver’s responsibility to operate the vehicle.
Who is responsible if a self-driving car crashes?
It depends on what caused the crash. Responsibility may fall on the human driver, vehicle owner, manufacturer, software developer, or another party. Investigators must examine the facts before determining who may be legally responsible.
About the Authors

Angel Reyes
Writer
Angel L. Reyes, III is the Founder and Managing Partner of Angel Reyes & Associates. A nationally recognized trial attorney and business leader, Angel has helped over 70,000 injury victims recover more than $1 billion since founding the firm in 1993. Named to the Texas Super Lawyers list annually since 2008, Angel brings Wall Street experience, Ivy League education, and a deep commitment to client advocacy. He is a frequent legal commentator and published author with extensive contributions to legal scholarship, trial strategy, and consumer protection.

Graham Griffin
Editor
Graham Griffin is the editorial director responsible for accuracy and legal compliance across all firm content.
Graham Griffin
Reviewer
Graham Griffin also serves as legal reviewer, ensuring all claims and advice reflect current Texas statutes and case law.