June 26, 2026
Car Accident vs. Truck Accident Claims in Texas
You were driving home on I-35 when an 18-wheeler changed lanes without warning. Now you’re dealing with injuries, vehicle damage...
A Detailed Study of Top American Cities for Road Rage.
Key Takeaways
Road rage, characterized as aggressive or violent motorist actions, has increased by 500% over the past decade, per CNN. Officially, it encompasses aggression ranging from verbal insults to physical violence. Road rage endangers lives and signifies underlying societal stress.
Road rage, characterized as aggressive or violent motorist actions, has increased by 500% over the past decade, per CNN. Officially, it encompasses aggression ranging from verbal insults to physical violence. Road rage endangers lives and signifies underlying societal stress.
Road rage has escalated due to societal, psychological, and environmental factors. Urban growth and traffic congestion heighten frustration from long commutes. Distractions from in-car technology and smartphones increase driving errors, provoking conflicts. Post-pandemic anxiety, economic stress, and normalized aggressive driving behaviors, often fueled by social media, exacerbate the issue.
Road rage worsens due to inconsistent consequences for reckless driving, emboldening drivers to act without fear of reprisal. Contributing factors include the popularity of powerful vehicles, emotional triggers like aggressive music, and viral videos of road rage. Combating this issue demands public education, stricter traffic law enforcement, and driver patience and self-awareness.
At Angel Reyes & Associates, we specialize in personal injury cases and are committed to fostering road safety. By identifying the most road rage-prone cities in the U.S., we aim to shed light on the growing epidemic of road rage and promote safer driving behaviors.
Our study analyzed a hundred US cities to find the country’s road rage capital. To do this, we examined some of the aggravating aspects of commuting, such as time wasted and the inefficiency of a city’s transport network. We also examined recorded violent outbursts on the road, such as shootings and reckless driving. These factors were combined to create a comprehensive Total Road Rage Score for each city.
Commuting in congested urban areas often triggers road rage due to stress and frustration. Long hours in stop-and-go traffic, frequent delays, and time pressure amplify negative emotions. Drivers feel a lack of control, leading to impatience. Poorly timed signals, construction zones, and reckless behavior from others worsen stress, reducing drivers’ tolerance and increasing aggression.
Driving conditions also significantly contribute to road rage. Poor weather, such as heavy rain, snow, or fog, reduces visibility and road safety, heightening tension. Poorly maintained roads, lane closures, and detours worsen frustration, especially for fatigued or stressed drivers. Perceived slights, such as tailgating or unnecessary honking, often escalate minor annoyances into dangerous road rage incidents.
Commuting fatigue from long hours in traffic drains drivers physically and mentally. This exhaustion reduces patience, heightens irritability, and makes minor inconveniences more likely to trigger road rage.
Stress and anxiety from time pressure, personal issues, or work worries create a tense mindset. This tension amplifies negative reactions to minor frustrations, such as delays or other drivers’ behavior.
Poorly maintained roads with potholes and uneven surfaces slow traffic and heighten frustration. This frustration often leads to aggressive behavior as drivers vent their impatience on others.
Unexpected lane closures from construction or accidents disrupt traffic, cause delays, and force drivers to merge. This unpredictability triggers aggressive maneuvers and short tempers among drivers.
Bad weather, such as heavy rain, snow, or fog, reduces visibility and road safety, increasing stress. Pressured drivers may become impatient or overreact to slow or cautious behavior from others.
Unplanned detours cause confusion and extend travel time, leaving drivers frustrated and disoriented. These disruptions to routine commutes often escalate irritation.
Reckless driving behaviors like tailgating, speeding, abrupt lane changes, or cutting off others trigger road rage. Witnessing or experiencing these actions often makes drivers feel disrespected or endangered, escalating frustration and prompting aggressive retaliation.
Our analysis highlights U.S. cities with the highest road rage incidents. Houston, Texas, ranks as the most dangerous city for road rage, followed by Los Angeles, California, as the only two cities scoring over 60. Chicago, Nashville, and Miami rank third to fifth, with aggregate scores within 0.10 points of each other.

Total Road Rage Score: 64.15
Houston ranks as the U.S. city most prone to road rage, with a Shooting Score of 36, Reckless Driving Score of 69, and Total Road Rage Score of 64.15. Its sprawling layout and high Commute Dissatisfaction Score of 76 intensify frustrations, escalating road incidents and violent altercations. Houston highlights the urgent need for better traffic management and public awareness to encourage safer driving.

Total Road Rage Score: 63.25
Los Angeles has a Commute Dissatisfaction Score and Inefficiency Score of 88, reflecting challenges in its congested road network. With a Total Road Rage Score of 63.25, it is a hotspot for driver frustration. Prolonged gridlocks and urban hustle heighten tempers. Despite a lower Shooting Score of 18 compared to Houston, aggression during commutes remains a concern. Efforts to address road rage focus on alleviating traffic and promoting alternative transit options.

Total Road Rage Score: 56.35
Chicago's dense traffic and infrastructure limitations result in a Total Road Rage Score of 56.35. Drivers contend with a Commute Dissatisfaction Score of 77 and a Reckless Driving Score of 46, reflecting unsafe road behaviors. A Shooting Score of 33 underscores rising tensions during stressful commutes. Enhancing infrastructure and promoting public transit could reduce road rage and improve safety for residents.

Total Road Rage Score: 56.25
Nashville's rapid growth has surpassed its road capacity, leading to a Total Road Rage Score of 56.25. A Commute Dissatisfaction Score of 70 and a Reckless Driving Score of 63 reflect daily frustrations for drivers, while a Shooting Score of 26 highlights the violent outcomes. Urban planning efforts focus on managing congestion and promoting safer driving behaviors.

Total Road Rage Score: 56.15
Miami faces a high road rage risk, with a Total Road Rage Score of 56.15. Congested streets contribute to a Commute Dissatisfaction Score of 81, while aggressive behaviors are evident in a Reckless Driving Score of 43 and a Shooting Score of 24. Traffic reforms and campaigns promoting respectful driving are essential to address systemic road challenges

Total Road Rage Score: 55.75
Philadelphia's Total Road Rage Score of 55.75 highlights a challenging driving environment marked by narrow streets and dense traffic. A Reckless Driving Score of 47 and a Shooting Score of 30 underscore struggles with aggressive driving. Enhancing the Commute Dissatisfaction Score of 72 through improved traffic management could help curb road rage incidents

Total Road Rage Score: 54.75
Atlanta's Total Road Rage Score of 54.75 reflects significant commuter frustrations. A Commute Dissatisfaction Score of 74 and a Reckless Driving Score of 62 highlight roadway inefficiencies, while a lower Shooting Score of 11 minimizes violent incidents. Expanding public transit options could significantly reduce driver dissatisfaction and aggressive behaviors.

Total Road Rage Score: 52.95
Detroit's Total Road Rage Score of 52.95 reflects its economic struggles and road infrastructure challenges. A high Commute Dissatisfaction Score of 84 and a Reckless Driving Score of 16 highlight frustrations caused by poor road conditions. Revitalizing Detroit's transportation system is essential to improving road safety and reducing commuter stress.

Total Road Rage Score: 52.75
New York City's Total Road Rage Score of 52.75 highlights challenges from overcrowded streets and congestion, despite its robust transit system. Drivers face a high Commute Dissatisfaction Score of 82, while a Shooting Score of 6 points to rare violent incidents. Reducing gridlock and promoting alternative transportation are crucial for improving road safety.

Total Road Rage Score: 51.85
Boston's Total Road Rage Score of 51.85 highlights struggles with congested, winding streets. A Commute Dissatisfaction Score of 85 and a Shooting Score of 6 underscore driver tensions. Ongoing construction projects and road improvements aim to reduce these pressures and enhance traffic flow.
| Rank | |
| Commute Time Score | |
| Commute Dissatisfaction Score | |
| Inefficiency Score | |
| Wasted Time Score | |
| Shooting Score | |
| Reckless Driving Score | |
| Total Road Rage Score |
| Rank | City | State | Commute Time Score | Commute Dissatisfaction Score | Inefficiency Score | Wasted Time Score | Shooting Score | Reckless Driving Score | Total Road Rage Score |
|---|---|---|---|---|---|---|---|---|---|
| 1 | Houston | TX | 76 | 76 | 75 | 76 | 36 | 69 | 64.15 |
| 2 | Los Angeles | CA | 88 | 88 | 88 | 88 | 18 | 59 | 63.25 |
| 3 | Chicago | IL | 77 | 77 | 58 | 77 | 33 | 46 | 56.35 |
| 4 | Nashville | TN | 70 | 70 | 60 | 70 | 26 | 63 | 56.25 |
| 5 | Miami | FL | 81 | 81 | 70 | 81 | 24 | 43 | 56.15 |
| 6 | Philadelphia | PA | 72 | 72 | 77 | 72 | 30 | 47 | 55.75 |
| 7 | Atlanta | GA | 74 | 74 | 69 | 74 | 11 | 62 | 54.75 |
| 8 | Detroit | MI | 84 | 84 | 81 | 84 | 29 | 16 | 52.95 |
| 9 | New York | NY | 82 | 82 | 47 | 82 | 6 | 55 | 52.75 |
| 10 | Boston | MA | 85 | 85 | 76 | 85 | 6 | 35 | 51.85 |
| 11 | Seattle | WA | 80 | 80 | 68 | 80 | 12 | 40 | 51.8 |
| 12 | Aurora | CO | 71 | 71 | 78 | 71 | 15 | 46 | 51.45 |
| 13 | Austin | TX | 60 | 60 | 72 | 60 | 19 | 61 | 51.2 |
| 14 | Dallas | TX | 54 | 54 | 50 | 54 | 28 | 67 | 50.35 |
| 15 | San Francisco | CA | 86 | 86 | 87 | 86 | 9 | 16 | 49.35 |
| 16 | Tacoma | WA | 83 | 83 | 80 | 83 | 5 | 25 | 48.7 |
| 17 | Charlotte | NC | 59 | 59 | 67 | 59 | 11 | 60 | 48.05 |
| 18 | Washington | DC | 73 | 73 | 74 | 73 | 13 | 32 | 47.85 |
| 19 | Arlington | TX | 78 | 78 | 30 | 78 | 9 | 45 | 47.7 |
| 20 | Phoenix | AZ | 49 | 49 | 38 | 49 | 31 | 66 | 47.65 |
| 21 | Denver | TX | 57 | 57 | 66 | 57 | 15 | 58 | 47.65 |
| 22 | San Antonio | TX | 44 | 44 | 42 | 44 | 34 | 68 | 47.3 |
| 23 | Jacksonville | FL | 52 | 52 | 71 | 52 | 19 | 57 | 46.9 |
| 24 | Riverside | CA | 87 | 87 | 85 | 87 | 2 | 11 | 46.55 |
| 25 | Honolulu | HI | 75 | 75 | 65 | 75 | 4 | 28 | 44.5 |
| 26 | Tampa | FL | 64 | 64 | 51 | 64 | 9 | 41 | 43.2 |
| 27 | San Jose | CA | 69 | 69 | 59 | 69 | 3 | 34 | 42.75 |
| 28 | Orlando | FL | 62 | 62 | 63 | 62 | 14 | 30 | 42.1 |
| 29 | Anaheim | CA | 79 | 79 | 86 | 79 | 2 | 4 | 41.7 |
| 30 | Milwaukee | WI | 41 | 41 | 37 | 41 | 35 | 49 | 41.1 |
| 31 | Oakland | CA | 63 | 63 | 64 | 63 | 19 | 19 | 41.1 |
| 32 | Mesa | AZ | 58 | 58 | 54 | 58 | 7 | 42 | 40.85 |
| 33 | Raleigh city | NC | 55 | 55 | 44 | 55 | 10 | 43 | 39.65 |
| 34 | Portland | OR | 47 | 47 | 34 | 47 | 8 | 56 | 38.2 |
| 35 | Long Beach | CA | 65 | 65 | 57 | 65 | 4 | 21 | 37.95 |
| 36 | New Orleans | LA | 38 | 38 | 39 | 38 | 20 | 52 | 37.1 |
| 37 | Columbus | OH | 42 | 42 | 61 | 42 | 22 | 33 | 36.65 |
| 38 | Fort Worth | TX | 27 | 27 | 28 | 27 | 28 | 64 | 36.6 |
| 39 | Toledo | OH | 66 | 66 | 52 | 66 | 4 | 16 | 36.6 |
| 40 | San Diego | CA | 53 | 53 | 56 | 53 | 3 | 36 | 36.55 |
| 41 | Indianapolis | IN | 40 | 40 | 45 | 40 | 25 | 39 | 36.5 |
| 42 | Irvine | CA | 68 | 68 | 83 | 68 | 1 | 1 | 36 |
| 43 | St. Petersburg | FL | 46 | 46 | 84 | 46 | 6 | 29 | 35.55 |
| 44 | Las Vegas | NV | 34 | 34 | 31 | 34 | 23 | 50 | 34.95 |
| 45 | Tucson | AZ | 33 | 33 | 27 | 33 | 21 | 53 | 34.4 |
| 46 | Plano | TX | 67 | 67 | 35 | 67 | 3 | 11 | 33.8 |
| 47 | Albuquerque | NM | 28 | 28 | 25 | 28 | 27 | 51 | 33.2 |
| 48 | Memphis | TN | 17 | 17 | 19 | 17 | 32 | 65 | 32.95 |
| 49 | Minneapolis | MN | 56 | 56 | 53 | 56 | 10 | 7 | 31.95 |
| 50 | Cleveland | OH | 48 | 48 | 40 | 48 | 15 | 20 | 31.95 |
| 51 | Colorado Springs | CO | 26 | 26 | 46 | 26 | 18 | 48 | 31.5 |
| 52 | Gilbert | AZ | 61 | 61 | 43 | 61 | 1 | 10 | 31.45 |
| 53 | Huntsville | AL | 50 | 50 | 82 | 50 | 3 | 8 | 30.95 |
| 54 | Oklahoma City | OK | 39 | 39 | 55 | 39 | 19 | 17 | 30.1 |
| 55 | El Paso | TX | 25 | 25 | 36 | 25 | 7 | 54 | 28.85 |
| 56 | Stockton | CA | 45 | 45 | 49 | 45 | 8 | 14 | 28.4 |
| 57 | Anchorage | AK | 24 | 24 | 79 | 24 | 3 | 37 | 27.5 |
| 58 | Baltimore | MD | 43 | 43 | 26 | 43 | 16 | 12 | 26.8 |
| 59 | Des Moines | IA | 36 | 36 | 73 | 36 | 2 | 18 | 26.7 |
| 60 | San Juan | PR | 51 | 51 | 41 | 51 | 1 | 1 | 25 |
| 61 | Cincinnati | OH | 29 | 29 | 48 | 29 | 16 | 16 | 24.4 |
| 62 | Fresno | CA | 22 | 22 | 62 | 22 | 8 | 28 | 24 |
| 63 | Sacramento | CA | 31 | 31 | 24 | 31 | 5 | 27 | 22.8 |
| 64 | Kansas City | MO | 37 | 37 | 32 | 37 | 4 | 15 | 22.75 |
| 65 | Louisville | KY | 12 | 12 | 16 | 12 | 17 | 46 | 22.15 |
| 66 | Madison | WI | 32 | 32 | 29 | 32 | 3 | 13 | 19.7 |
| 67 | Reno | NV | 16 | 16 | 22 | 16 | 3 | 38 | 18.85 |
| 68 | St. Louis | MO | 30 | 30 | 33 | 30 | 11 | 3 | 18.8 |
| 69 | Fort Wayne | IN | 35 | 35 | 20 | 35 | 5 | 6 | 18.75 |
| 70 | Henderson | NV | 23 | 23 | 18 | 23 | 3 | 22 | 17.25 |
| 71 | Winston-Salem | NC | 19 | 19 | 23 | 19 | 2 | 24 | 16.4 |
| 72 | Greensboro | NC | 9 | 9 | 6 | 9 | 2 | 43 | 15.45 |
| 73 | Durham | NC | 11 | 11 | 15 | 11 | 8 | 26 | 14.4 |
| 74 | Lubbock | TX | 6 | 6 | 3 | 6 | 2 | 44 | 14.2 |
| 75 | Wichita | KS | 14 | 14 | 11 | 14 | 11 | 16 | 13.45 |
| 76 | Corpus Christi | TX | 2 | 2 | 4 | 2 | 2 | 44 | 12.7 |
| 77 | Lexington | KY | 20 | 20 | 14 | 20 | 2 | 10 | 12.4 |
| 78 | St. Paul | MN | 21 | 21 | 12 | 21 | 7 | 2 | 11.85 |
| 79 | Norfolk | VA | 18 | 18 | 21 | 18 | 3 | 5 | 11.3 |
| 80 | Richmond | VA | 13 | 13 | 10 | 13 | 8 | 10 | 10.7 |
| 81 | Irving | TX | 4 | 4 | 2 | 4 | 4 | 31 | 10.55 |
| 82 | Tulsa | OK | 8 | 8 | 13 | 8 | 15 | 9 | 10.5 |
| 83 | Virginia Beach | VA | 10 | 10 | 9 | 10 | 4 | 18 | 10.4 |
| 84 | Boise City | ID | 15 | 15 | 17 | 15 | 2 | 5 | 9.45 |
| 85 | Bakersfield | CA | 3 | 3 | 8 | 3 | 6 | 23 | 9.25 |
| 86 | Omaha | NB | 7 | 7 | 7 | 7 | 9 | 4 | 6.75 |
| 87 | Sioux Falls | SD | 5 | 5 | 5 | 5 | 1 | 9 | 5 |
| 88 | Lincoln | NB | 1 | 1 | 1 | 1 | 3 | 1 | 1.5 |
Long and unproductive commutes can turn even the calmest driver into a ball of frustration, especially in cities where traffic congestion is part of daily life. Los Angeles leads the pack with the highest commute dissatisfaction score in the country—88. With drivers wasting over 100 hours a year sitting in traffic, it’s no wonder tempers flare. The city’s gridlocked roads and inefficient infrastructure make every trip feel like a test of patience. Nearby Riverside isn’t far behind, with a score of 80. The city’s suburban sprawl and limited public transportation force residents into lengthy, stress-filled drives, often leaving them frazzled and prone to road rage.
San Francisco faces its own challenges, scoring 79 on the dissatisfaction index. Its densely packed streets, hilly terrain, and heavy traffic make commutes both frustrating and time-consuming. Boston, with a score of 85, deals with historic, narrow streets and constant construction, creating delays that push drivers to their limits. In Detroit, a score of 84 reflects long travel times and deteriorating road conditions that add to drivers’ frustration. These cities highlight the undeniable connection between extended commute times, rising stress, and aggressive driving behaviors. On the other hand, places like Boise and Sioux Falls, where commutes are shorter and have minimal traffic, show how smoother travel can create a calmer driving environment.
While road rage is common in many urban areas, certain cities stand out for their calmer, more cooperative driving environments.
These cities share common characteristics, such as efficient infrastructure, reduced congestion, and a patient, cooperative driving culture, offering a benchmark for others striving to minimize road rage.

Total Road Rage Score: 1.50
Lincoln, Nebraska, stands out for its calm and cooperative driving environment, achieving the nation’s lowest road rage score of 1.50. This ranking reflects low dissatisfaction and reckless driving scores, well-maintained roads, shorter commutes, and efficient traffic flow, all contributing to a stress-free driving experience.

Total Road Rage Score: 5.00
Sioux Falls, South Dakota, ranks second with a total road rage score of 5.00, reflecting minimal congestion and low commute dissatisfaction.

Total Road Rage Score: 6.75
Omaha, Nebraska, scores 6.75, benefiting from thoughtful infrastructure and smooth traffic flow that foster driver patience and cooperation.

Total Road Rage Score: 9.25
Bakersfield, California, with a score of 9.25, enjoys spacious roads and effective traffic management despite occasional congestion.

Total Road Rage Score: 9.45
Boise City, Idaho, rounds out the list with a score of 9.45, where shorter commutes and a strong driving culture contribute to safer, more harmonious roadways.
| Rank | |
| Commute Time Score | |
| Commute Dissatisfaction Score | |
| Inefficiency Score | |
| Wasted Time Score | |
| Shooting Score | |
| Reckless Driving Score | |
| Total Road Rage Score |
| Rank | City | State | Commute Time Score | Commute Dissatisfaction Score | Inefficiency Score | Wasted Time Score | Shooting Score | Reckless Driving Score | Total Road Rage Score |
|---|---|---|---|---|---|---|---|---|---|
| 1 | Lincoln | NB | 1 | 1 | 1 | 1 | 3 | 1 | 1.5 |
| 2 | Sioux Falls | SD | 5 | 5 | 5 | 5 | 1 | 9 | 5 |
| 3 | Omaha | NB | 7 | 7 | 7 | 7 | 9 | 4 | 6.75 |
| 4 | Bakersfield | CA | 3 | 3 | 8 | 3 | 6 | 23 | 9.25 |
| 5 | Boise City | ID | 15 | 15 | 17 | 15 | 2 | 5 | 9.45 |
| 6 | Virginia Beach | VA | 10 | 10 | 9 | 10 | 4 | 18 | 10.4 |
| 7 | Tulsa | OK | 8 | 8 | 13 | 8 | 15 | 9 | 10.5 |
| 8 | Irving | TX | 4 | 4 | 2 | 4 | 4 | 31 | 10.55 |
| 9 | Richmond | VA | 13 | 13 | 10 | 13 | 8 | 10 | 10.7 |
| 10 | Norfolk | VA | 18 | 18 | 21 | 18 | 3 | 5 | 11.3 |
| 11 | St. Paul | MN | 21 | 21 | 12 | 21 | 7 | 2 | 11.85 |
| 12 | Lexington | KY | 20 | 20 | 14 | 20 | 2 | 10 | 12.4 |
| 13 | Corpus Christi | TX | 2 | 2 | 4 | 2 | 2 | 44 | 12.7 |
| 14 | Wichita | KS | 14 | 14 | 11 | 14 | 11 | 16 | 13.45 |
| 15 | Lubbock | TX | 6 | 6 | 3 | 6 | 2 | 44 | 14.2 |
| 16 | Durham | NC | 11 | 11 | 15 | 11 | 8 | 26 | 14.4 |
| 17 | Greensboro | NC | 9 | 9 | 6 | 9 | 2 | 43 | 15.45 |
| 18 | Winston-Salem | NC | 19 | 19 | 23 | 19 | 2 | 24 | 16.4 |
| 19 | Henderson | NV | 23 | 23 | 18 | 23 | 3 | 22 | 17.25 |
| 20 | Fort Wayne | IN | 35 | 35 | 20 | 35 | 5 | 6 | 18.75 |
Road rage can lead to severe and deadly outcomes. Some U.S. cities face high levels of violence from shootings and hit-and-runs linked to aggressive driving. Houston ranks highest with a Shooting Score of 36, fueled by traffic congestion and reckless driving. Chicago follows with a score of 33, where urban traffic sparks confrontations. Detroit’s score of 29 reflects poor infrastructure and delays contributing to road rage. Philadelphia, with a score of 30, sees narrow streets and heavy traffic escalate into altercations. Miami’s score of 24 highlights how aggressive driving and traffic issues foster violence.
Prolonged stress, delays, and erratic driving escalate frustration into violence. Minor disputes, such as honking or cutting off drivers, quickly spiral when emotions run high. Combating this trend requires better traffic infrastructure to reduce delays and driver education on anger management to defuse tension. Addressing triggers and responses can prevent violence and create safer roads.
Managing road rage begins with staying calm during frustrating commutes or encounters with aggressive drivers. Controlling emotions behind the wheel is essential to ensure both your safety and the safety of others.
Prolonged traffic delays, like those in Los Angeles and Detroit, can test anyone’s patience. To mitigate stress:
Allow extra time for your commute to reduce anxiety about delays.
Deep breathing exercises or mental reframing can help manage stress.
Listen to soothing music, audiobooks, or podcasts to distract from the frustrations of stop-and-go traf
Erratic or reckless drivers, like those contributing to Miami’s Reckless Driving Score of 43, can provoke anger. Instead of reacting:
Avoid eye contact or retaliatory actions, such as honking or tailgating, which can escalate tensions.
Give aggressive drivers plenty of space to avoid potential accidents.
Remind yourself that others' bad behavior is not a personal attack but a reflection of their state of mind.
Succumbing to road rage can lead to severe consequences, including violence, hit-and-runs, or legal issues. Cities like Houston, with a Shooting Score of 36, and Chicago, at 33, highlight the dangers of aggressive reactions. Staying calm protects you from harm and sets a positive example for other drivers.
Following traffic laws, such as adhering to speed limits and using turn signals, fosters a safer driving environment and reduces unnecessary conflicts. Taking regular breaks during long drives helps refresh your mind and prevents irritability from fatigue. Practicing empathy by acknowledging others’ challenges promotes patience and creates a cooperative driving atmosphere.
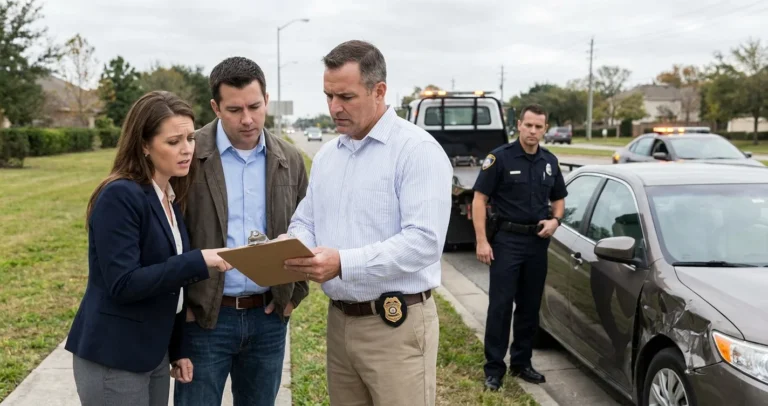
Victims of road rage or reckless driving often face physical, emotional, and financial burdens. If harmed by another driver’s aggression or negligence, understanding your rights and the steps to seek justice is crucial for recovery.
Angel Reyes & Associates specializes in personal injury cases, providing expert guidance to victims of road rage and reckless driving. The firm’s legal expertise and dedication have helped clients secure compensation for medical expenses, property damage, lost wages, and pain and suffering. With offices in Dallas, Houston, Fort Worth, and Austin, the firm is able to assist victims of road rage in some of the busiest areas of Texas.
Angel Reyes & Associates provides free consultations to assess your situation and recommend the best course of action. The team investigates incidents, manages communications with insurance companies, and builds strong cases to hold responsible parties accountable.
This study ranks U.S. cities based on road rage and traffic stress levels using key metrics such as Commuting Dissatisfaction Scores, Reckless Driving Scores, and Shooting Scores. Together, these metrics and Total Road Rage Scores and Commute Time Scores provide a comprehensive view of driving conditions.
Cities were evaluated on logistical inefficiencies and behavioral outcomes, with higher scores indicating greater challenges. By weighting these factors, the study offers a balanced assessment of the causes and impacts of road rage, highlighting areas with the most and least stressful driving environments.
Data for these metrics was sourced from Numbeo, NHTSA, Gun Violence Archive, and the U.S. Census, ensuring a well-rounded assessment of driving conditions.
Road rage and reckless driving can have devastating consequences, but you don’t have to face the aftermath alone. If you or a loved one has been involved in a road rage incident or suffered injuries due to another driver’s negligence, Angel Reyes & Associates is here to help. With years of experience in personal injury law, our team is committed to securing the compensation and justice you deserve.
Don’t wait, contact Angel Reyes & Associates today for a free consultation. Let us guide you through the legal process and help you confidently move forward. Your recovery is our priority.
June 26, 2026
You were driving home on I-35 when an 18-wheeler changed lanes without warning. Now you’re dealing with injuries, vehicle damage...
May 21, 2026
You were rear-ended in rush hour traffic on I-35 near downtown Austin last week. Your neck still hurts, and you’ve started physical therapy...
May 21, 2026
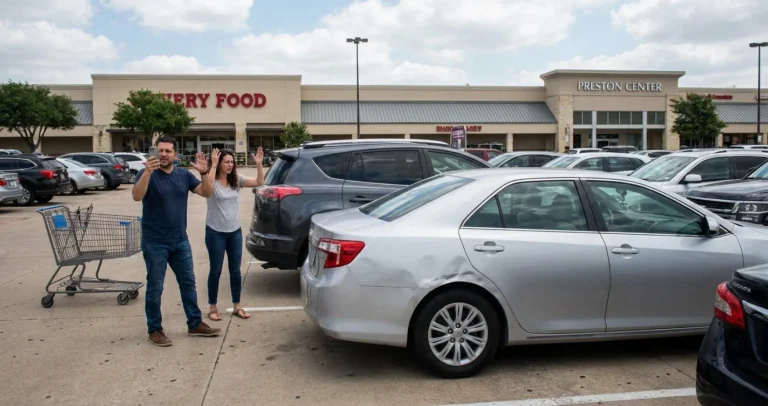
Estimates show that parking lot accidents account for approximately 20% of all car accidents in Texas..