30 Shocking Texas Car Accident Facts from TxDOT’s 2025 Crash Data


Every article on this site is researched by our internal team, reviewed for legal accuracy against current Texas law, and held to State Bar of Texas advertising standards before publication. We do not publish content that overstates outcomes or makes promises about results.
Learn more about our
editorial standards .
Key Takeaways
- TxDOT’s 2025 crash data reveals when, where, and how fast the roads turn deadly, and it sometimes isn’t where you'd guess.
- Time of day changes your crash risk far more than traffic volume, upending common assumptions about safe driving.
- Rural roads carry a wildly outsized share of Texas traffic deaths, exposing a safety gap most drivers never consider.
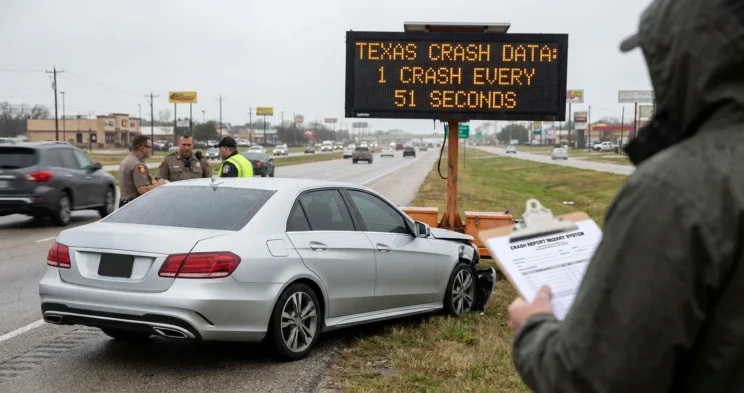
Most drivers picture danger as heavy traffic: bumper-to-bumper lanes, short tempers, near misses. Texas’s own crash data says otherwise.
Texas recorded 618,706 reported crashes in 2025, seriously injuring 17,975 people and ultimately leading to 3,814 fatalities. That’s a staggering amount of accidents from any perspective. However, when you dig further into the data, a few observations tell some additional stories.
Here are 30 surprising car accident facts about our roads here in Texas that are borne out by real crash data obtained from the Texas Department of Transportation’s Crash Report Inquiry System (CRIS)*.
The Scale: Texas Crashes in 2025
1. A car crash was reported every 51 seconds in Texas in 2025.
The total of 618,706 crashes works out to 1,695 crashes a day across Texas, or roughly 71 every hour, around the clock. TxDOT’s own published quick fact for 2024 put the pace at one crash every 57 seconds, meaning the crash rate increased from year to year.
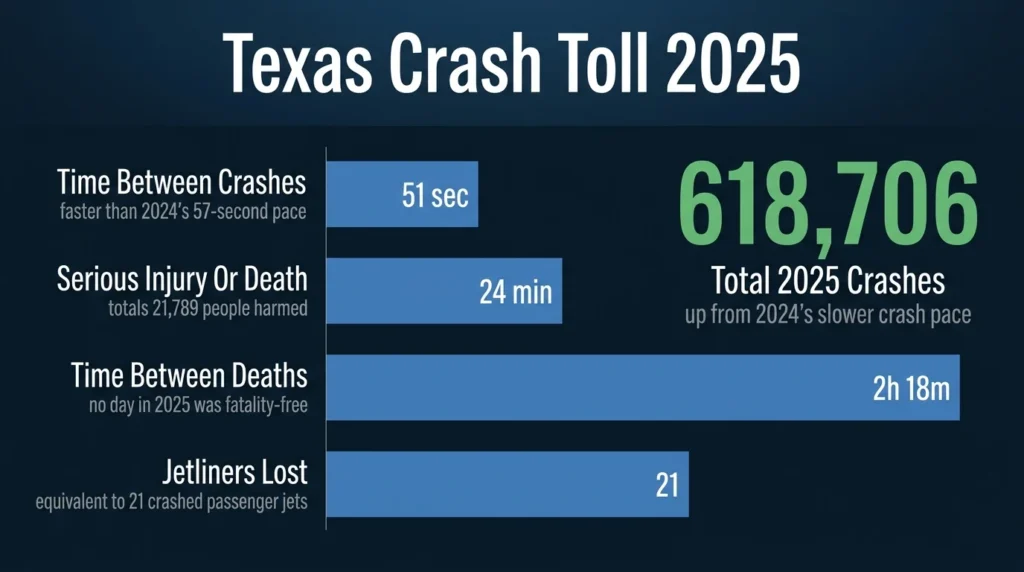
2. Someone in Texas suffered a fatal or serious injury every 24 minutes.
Fatalities alone undercount the damage by a factor of six. Add the 17,975 people who suffered a suspected serious injury and the total reaches 21,789, or 59.7 a day. Injuries are considered “serious” when they carry permanent, life-altering injuries.
3. Not one single day in 2025 passed without someone dying on a Texas road.
The year’s toll came to 3,814 people, which averages one death every 2 hours and 18 minutes.
This is the streak TxDOT built the #EndTheStreakTX campaign around. According to their records, the last deathless day on Texas roads was November 7, 2000, meaning it has now been a quarter century since a day without a driving fatality within the state.
4. Texas lost the equivalent of 21 fully loaded passenger jets.
At roughly 180 seats on a modern Boeing 737, that is a little more than one going down every three weeks for a year. If 21 airliners crashed in Texas, you would have heard about every single one.
5. Only 1 crash in 175 resulted in a fatality.
It seems odd to say only 3,521 crashes were fatal, but the truth is that figure includes just 0.57% of the more than 600,000 total. Widen the lens to include catastrophic injuries and the number becomes just 1 crash in every 34. Meanwhile 72% produced no injury at all.
6. Roughly 1.56 million people were involved in a reported Texas crash.
That total comes from summing every person-severity category across the year. It includes 1,195,818 people who walked away uninjured and 124,872 with possible injuries. (The count also includes non-residents, and anyone in two crashes appears twice.)
When Texas Roads Turn Deadly
The hour on the clock shifts your odds more than almost anything else you control. Most people think crashes are more likely to happen at night due to poor visibility, but the numbers don’t necessarily agree.
7. Overnight hours produced 9% of crashes and 25% of deaths.
Between midnight and 5 a.m., Texas logged 57,391 crashes and 964 deaths. Every hour in that window carries a fatality rate two to three times the statewide average. While crashes in these hours were less likely, they were far more likely to be fatal.
8. 2 a.m. is the least-busy hour on Texas roads, but also one of the deadliest.
The fatality rate per 1,000 crashes runs 19.45 at 2 a.m. and 2.86 at 4 p.m. That’s a fatality rate nearly seven times higher. And 4 p.m. is the single busiest hour on Texas roads, with 50,277 crashes. The 2 a.m. hour is one of the quietest, at 10,951.
9. The deadliest hour of the week in Texas was 2 a.m. on Monday.
Saturday at 4 a.m. and Saturday at 2 a.m. follow close behind it in fatality rate.
Monday at 2 a.m. is really late Sunday night, the tail end of the weekend. If you are out late on a Sunday, a delayed departure or a ride home is worth the inconvenience.
10. Sunday was the deadliest day of the week, and Wednesday the safest.
Deaths per 1,000 crashes run 9.70 on Sunday and 8.17 on Saturday, then drop to 5.00 on Wednesday. Weekend crashes are 68% deadlier than weekday crashes.
Friday has the most crashes of any weekday at 100,934, but with a middling fatality rate. Sunday has the fewest crashes of any day at 68,434, but also has the highest death rate. Volume and lethality run in opposite directions across the week.
11. Christmas Day was the quietest day on Texas roads and also the deadliest.
December 25, 2025 produced only 905 crashes, fewer than any other day of the year. However, 15 of them were fatal, a rate of 16.57 per 1,000** and the highest single-day figure of 2025. New Year’s Day came in almost identical, with 1,167 crashes and 19 deaths.
Empty roads, holiday travel, limited daylight, and late hours combine into the deadliest mix Texas produces all year.
The Rural Death Gap
Rural Texas produces about a fifth of the state’s crashes and nearly half of its road fatalities. A crash outside city limits is close to three times more likely to be fatal.
12. Rural Texas produced 22% of crashes and 45% of deaths.
Texas recorded 135,549 crashes and 1,717 deaths occurring outside city limits. The fatality rate in these crashes came out to 12.67 per 1,000 accidents, compared to just 4.34 inside city limits. Rural roads also produced 35% of all serious crash-related injuries in the state.
Longer EMS response times, higher posted speeds, and two-lane roads without median barriers all contribute to this elevated danger.
13. Polk County was nearly six times deadlier per crash than Harris County.
Polk County, with an estimated population of just 53,000, recorded 1,021 crashes and 25 deaths in 2025, a rate of 24.49 per 1,000. Conversely, Harris County, the most populous in the state, recorded 124,339 crashes and 516 deaths, a rate of 4.15. Harris leads Texas in raw traffic deaths, but sits near the bottom in deaths per crash.
Liberty, Bastrop, and Grayson rank next among counties with at least 1,000 crashes. The full county-by-county death rankings run across all 254.
14. Fifteen of Texas’s 254 counties accounted for half of all traffic deaths.
The 15 deadliest counties accounted for 50.1% of the state total, which is a lopsided concentration for a state this large. At the other end, 27 counties recorded zero traffic deaths in 2025, and 29 more recorded exactly one.
15. Austin had the deadliest crashes of any major Texas city.
Among cities with at least 3,000 crashes, Austin leads at 7.65 deaths per 1,000 crashes, followed by Grand Prairie at 7.34. Fort Worth and Dallas sit at 6.51 and 6.49. Houston, with 67,076 crashes and 304 deaths, comes in at 4.53.
San Antonio, El Paso, and Laredo run lower still. Laredo is the outlier at 1.45, with 8,257 crashes and only 12 deaths. Within Dallas, crashes cluster heavily on the city’s most dangerous roads.
16. Permian Basin oilfield counties were nearly twice as deadly per crash as Texas overall.
Across 13 Permian counties, Texas logged 12,776 crashes and 148 deaths, a rate of 11.58 per 1,000 against the statewide 6.16. Midland and Ector both run above the state average despite being urbanized.
The 15 border counties combined came in at 3.08 fatalities per 1,000 crashes, half the statewide rate. Heavy truck traffic on two-lane oilfield roads is a well-known safety problem, and these numbers put just how big of a problem into context.
Speed Changes Everything
Posted speed limits can predict how lethal a crash will be more cleanly than any other variable in the data. Every step up the speed ladder steps up the fatality rate.
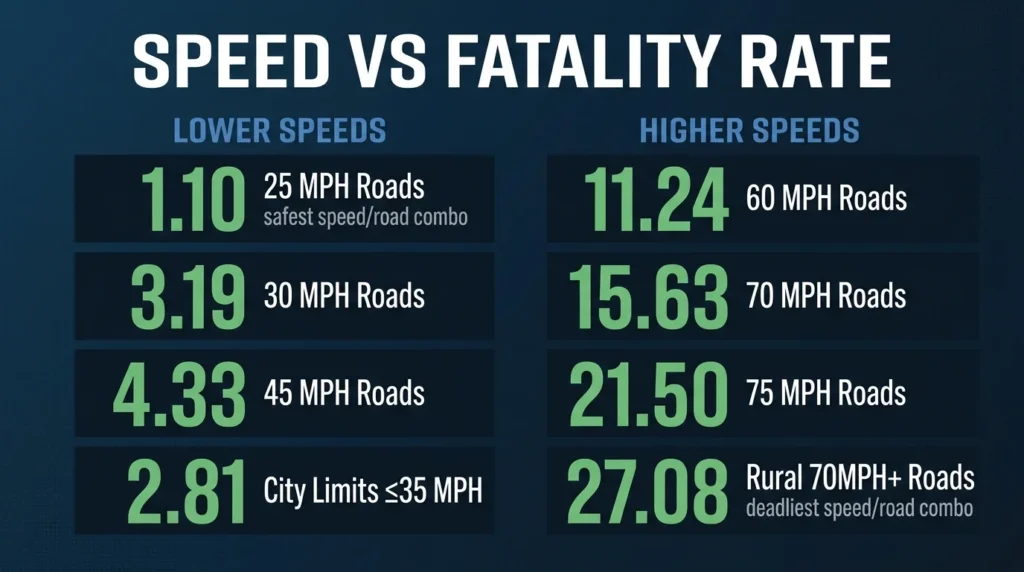
17. Crashes on 75-mph roads were nearly seven times deadlier than on 30-mph streets.
Speed directly impacts accident fatality, with higher speeds being deadlier. Data backs up this observation. Deaths per 1,000 crashes run 21.50 at 75 mph, 15.63 at 70 mph, and 11.24 at 60 mph. Further down the scale the rate falls to 4.33 at 45 mph, 3.19 at 30 mph, and 1.10 at 25 mph.
18. Roads posted 70 mph and above produced 8% of crashes and 23% of deaths.
Texas recorded 49,515 such crashes and 890 deaths on them. The fatality rate of 17.97 per 1,000 is nearly three times the state average. Texas also carries some of the highest posted limits in the country, including one 85-mph stretch.
19. The worst combination in Texas was a rural road posted 70 mph or higher.
Those roads produced 24,629 crashes and 667 deaths, a rate of 27.08 per 1,000. Inside city limits at 35 mph or less, Texas logged 190,570 crashes and 536 deaths, a rate of 2.81. This makes accidents on high-speed rural roads 9.6 times more likely to be deadly compared to urban or suburban roads.
Speeds far above the flow of traffic can also cross into reckless driving under Texas law.
20. U.S. highways were Texas’s deadliest road class, deadlier than the interstates.
Deaths per 1,000 crashes run 10.69 on U.S. highways and 9.87 on state highways and loops. County roads sit at 8.55, Farm-to-Market roads at 7.21, interstates at 6.29, and city streets at 5.87. The interstate is the safest highway class in Texas because it is divided, barriered, and engineered for the speeds they carry. Unfortunately, a lot of our highways carry similar speeds, but are not engineered with the same safety features in place.
Who Gets Hurt Most
Pedestrians, riders, and people in cars struck by trucks absorb a disproportionate share of the harm if they are involved in an accident. The data around their injuries and fatalities tells a grim story of reality, and these parties are rarely the ones at fault.
21. Texas lost 724 pedestrians, and 84% of them died away from an intersection.
Texas recorded 8,479 pedestrian-involved crashes in 2025, which also injured 7,397 people. Only 114 of the deaths happened at or near an intersection. A full 553 of them, 76%, happened in the dark.
The pattern points to mid-block crossings on high-speed arterials after dark, which is a lighting and infrastructure question. Texas right-of-way rules for pedestrians reach well beyond marked crosswalks.
22. Nine out of ten pedestrian-involved crashes resulted in a pedestrian injury or fatality.
Of those 8,479 crashes, 7,720 produced at least one pedestrian injury or death, which is 91.0%. Compare that to the 72% of all Texas crashes that produced no injuries at all.
Inside a car, a crash is usually survivable and sometimes even harmless. On foot, being struck essentially guarantees an injury of some degree. That gap is why pedestrian accident claims work differently from ordinary collision cases.
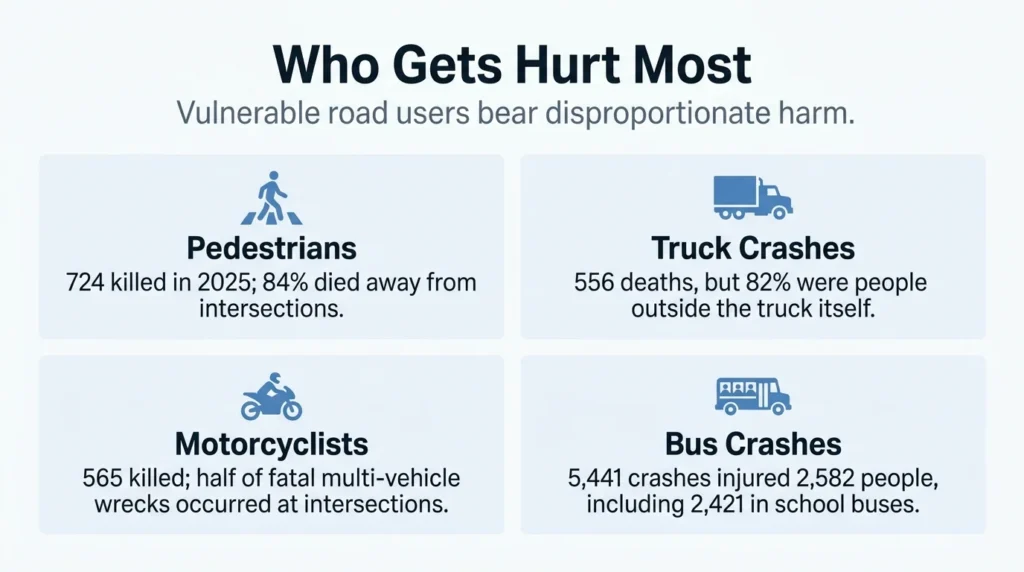
23. 82% of the 556 deaths in 2025 Texas truck crashes were not in the truck involved.
Those 55,278 truck-involved crashes also seriously injured 1,789 people. Of the 556 deaths, 458 were occupants of another vehicle or on foot. Only 98 were inside the truck itself.
Seventy-one of the 458 were pedestrians or cyclists. Mass asymmetry means the truck occupant usually walks away, and truck accident cases turn on that imbalance. Truck-involved crashes accounted for 14.6% of all Texas traffic deaths in 2025.
24. Texas lost 565 motorcyclists in 2025. Half of the fatal multi-vehicle wrecks happened at intersections.
Texas recorded 9,385 motorcycle-involved crashes in 2025. Of the 365 fatal multi-vehicle crashes among them, 184 happened at or near an intersection. A left-turn conflict appeared in 20% of multi-vehicle motorcycle crashes.
Motorcyclists are a small fraction of Texas road users and roughly 15% of the state’s traffic deaths. A driver turning left across a rider’s path is the recurring setup, and left-turn right-of-way rules are where most of these cases begin.
25. Texas recorded 5,441 bus-involved crashes, and 2,421 of them involved a school bus.
Those crashes injured 2,582 people across bus passengers, other drivers, and pedestrians. Another 237 of them injured three or more people each.
One crash injured 63. A single bus wreck can generate dozens of separate claims. That is why children hurt in bus crashes often involve more than one family at once.
Five Things This Data Disproves
Five widely repeated safety claims do not survive contact with the 2025 Texas numbers. Each one aims your attention at the wrong risk.
26. Intersections are not where Texas crashes turn fatal.
Have you ever heard the old saying “roads aren’t dangerous, where they cross is?” Turns out, that’s not backed up by data. Intersections account for 28.6% of crashes and 19.7% of deaths. The fatality rate for intersection crashes is 4.25 per 1,000, but 6.93 away from them.
Intersections are dangerous in a different way, producing 0.557 injuries per crash against 0.348 elsewhere, 60% more, and 30.8% of all serious injuries. Crash volume concentrates hard at the most dangerous intersections in Texas.
27. The 100 deadliest days of summer did not hold up in 2025.
The Memorial Day to Labor Day window averaged 10.62 deaths per day. The rest of the year averaged 10.37. The difference works out to roughly one extra death every four days.
This framing gets recycled every May, but the actual results were closer to a rounding error in 2025. Hopefully this trend continues in the future!
28. The evening commute was the safest busy hour of the week.
Weekday 4 to 6 p.m. is the highest-volume window of the week, with 81,748 crashes. It is also one of the safest per crash, at 2.70 deaths per 1,000. Saturday and Sunday from midnight to 4 a.m. produced 20,202 crashes at 17.87 per 1,000, or 6.6 times deadlier.
The hours you dread are the hours you are most likely to survive.
29. School zones were not a major crash danger.
Texas recorded 1,223 crashes in an active school zone across all of 2025, which is just 0.198% of the state total. That averages about 6.8 per school day statewide, clustered at 7 a.m. and 3 p.m. Injuries per crash inside active school zones ran 0.327 against 0.408 statewide.
Reduced limits, crossing guards, and heightened driver attention appear to work. However, they aren’t perfect: Texas still recorded three fatalities in active school zones.
30. Texas averaged 79 work-zone crashes a day.
Texas logged 29,003 construction-zone crashes in 2025, 4.7% of the total, with 195 deaths and 12,256 people injured. The fatality rate of 6.72 per 1,000 sits just above the 6.14 outside work zones, which is real but modest.
The daily volume is what stands out. That pace also works out to a work-zone death every 1.9 days.
The trend is improving. TxDOT’s published annual death tolls fell from 4,497 in 2021 to 4,481 in 2022, 4,291 in 2023, and 4,150 in 2024. Our own 2025 count came to 3,814.
TxDOT later restated the 2022 figure down to 4,410, and it has not yet published a final statewide summary for 2025. Texas roads are getting safer, and 3,814 people still died on them.
If a Texas Crash Changed Your Life
None of these numbers help much once you are the one in the crash. Angel Reyes & Associates has spent more than 30 years representing Texans hurt in car accidents across the state.
Our record includes more than $1 billion recovered for clients, and we work on contingency, so there is no fee unless we win. We are available 24 hours a day to take your call, and you can contact us for a free consultation in English or Spanish, anywhere in Texas.
The statistics discussed article is general information about public crash data and are intended for educational and commentary purposes only. This is not legal advice and does not in any way constitute an attorney-client relationship. Past results do not guarantee future outcomes.
About the Authors

Angel Reyes
Writer
Angel L. Reyes, III is the Founder and Managing Partner of Angel Reyes & Associates. A nationally recognized trial attorney and business leader, Angel has helped over 70,000 injury victims recover more than $1 billion since founding the firm in 1993. Named to the Texas Super Lawyers list annually since 2008, Angel brings Wall Street experience, Ivy League education, and a deep commitment to client advocacy. He is a frequent legal commentator and published author with extensive contributions to legal scholarship, trial strategy, and consumer protection.

Kyle Nicolas
Editor
Kyle Nicolas is the Web Content & SEO Manager at Angel Reyes & Associates. He has more than 10 years of experience as a marketing co...

Angel Reyes
Reviewer
Angel L. Reyes, III is the Founder and Managing Partner of Angel Reyes & Associates. A nationally recognized trial attorney and business...